

Data
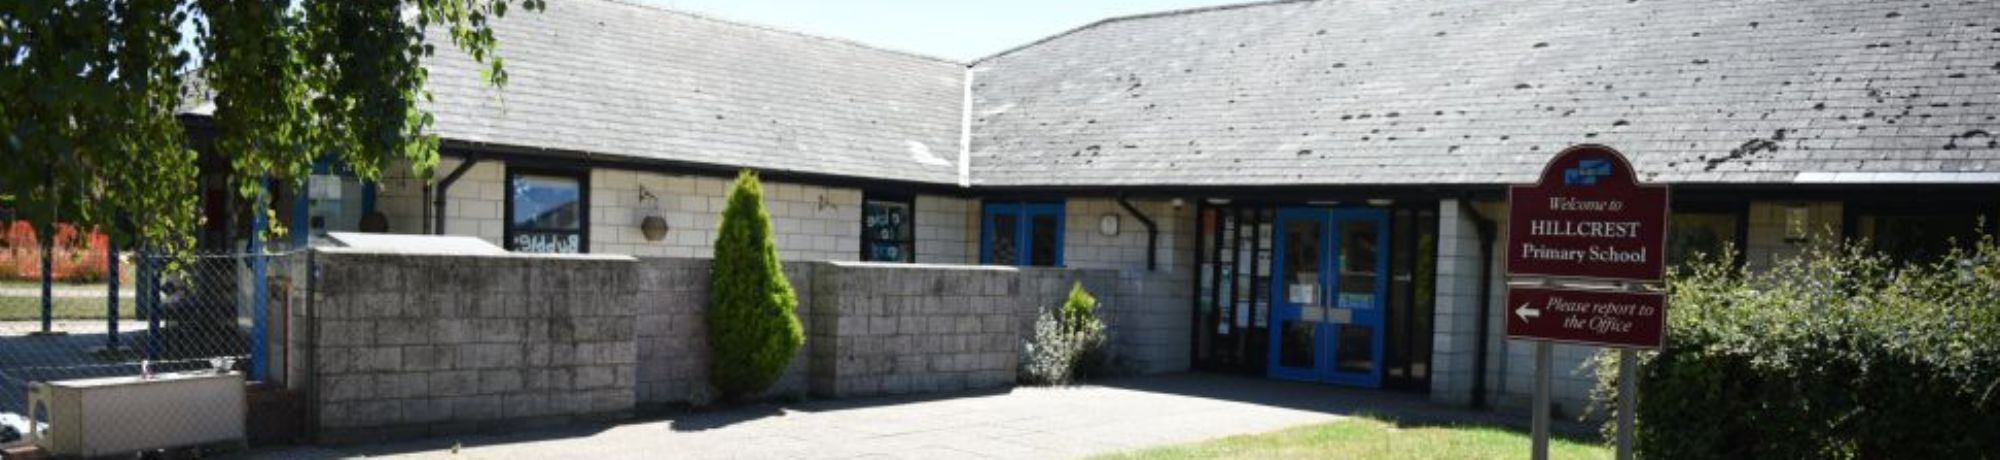
Hillcrest is a school in which all achievements are celebrated. Our pupils and staff work extremely hard to fulfil their potential.
Please see below for summaries of our pupils' fantastic achievements (rounded to the nearest whole number).
SUMMARY FOR HILLCREST PUPILS JULY 2024:
|
2024 |
2023 | 2022 (gap due to Covid) | 2019 | ||
|---|---|---|---|---|---|
|
|
Pupils who reached the expected standard or above in Reading (test result) |
79%(74% Nationally) |
73% | 86% | 80% |
|
|
Pupils who reached the higher level of attainment in Reading |
23%
|
20% |
33%
|
27%
|
|
|
Pupils who reached the expected standard or above in GPS (Grammar, Punctuation & Spelling) |
76%(72% Nationally) |
77% | 87% | 90% |
|
|
Pupils who reached the higher level of attainment in in GPS (Grammar, Punctuation & Spelling) |
35%
|
25% |
36%
|
43%
|
|
|
Pupils who reached the expected standard or above in Writing (Teacher Assessment) |
71.4%(72% Nationally) |
69% | 81% | 83% |
|
|
Pupils who reached the higher level of attainment in Writing |
12%
|
6% |
14%
|
28%
|
|
|
Pupils who reached the expected standard or above in Maths (test result) |
79%(73% Nationally) |
71% | 86% | 88% |
|
|
Pupils who reached the higher level of attainment in Maths |
25%
|
23% |
34%
|
37%
|
|
|
Pupils who reached the expected standard or above in Reading, Writing & Maths |
64%(61% Nationally) |
59% |
72%
|
77%
|
|
|
Pupils who reached the higher level of attainment in Reading, Writing & Maths |
7%
|
6% |
5%
|
12%
|
| 2024 | 2023 | 2022 (gap due to Covid) | 2019 | ||
|
SCALED SCORES are a standardised indication to show how well a pupil has performed |
|||||
|
|
Average Scaled Score in Reading |
105(105 Nationally) |
104 | 105.8 | 104 |
|
|
Average Scaled Score in Maths |
105(104 Nationally) |
104 | 105.8 | 106 |


Data for previous years can be viewed on the Department for Education’s performance website.
This School and College Performance Tables website will also give you access to the school’s facts and figures and allows you to compare it with other schools.